
ECONOMIC REVIEW(1)
- • Personal Spending was unchanged from a month prior, after an increase of 0.9% in April.
- • Personal Income decreased -2.0% for the month of May, slightly higher than economists’ forecasts which called for a decrease of 2.5% and an improvement over the April reading of -13.1%.
- • The Personal Consumption Expenditure Deflator (PCE) increased 0.4% on a month over month basis and jumped 3.9% on a year over year basis.
- • University of Michigan Consumer Sentiment Index came in at 85.5, missing economists’ expectations of 86.5.
- • New Home Sales missed forecasts coming it at 769,000, down roughly -5.9% on a month over month basis.
- • Initial Jobless Claims also missed, coming in higher than expected with a 411,000 print versus the expected reading of 380,000.
INSIGHT: While continuing to move in the right direction, in recent weeks, economic data has tended to miss economists’ forecasts, raising questions that the current economic recovery may not be as robust as expected. However, this divergence from economists’ forecasts and reported data may be reflective of the current supply constraints facing markets. Employers are having a difficult time filling job openings; therefore, the supply of goods and services has not met consumer demand. Similarly, with economies around the world reopening at different paces, the availability of materials and other key inputs is scarce, leading to increased prices of goods. The Federal Reserve has stated their belief that higher prices will be transitory and will revert to the longer-term average as we get further along in the economic reopening, however, there have been signs that some of measures of inflation may prove to be more persistentii. Over the past year consumer prices have risen 3.9%, reflecting the biggest gain since 2008 when oil prices hit a record high of $150 a barrel.
A LOOK FORWARD(1)
- • Initial jobless claims will be released on Thursday, with expectations of a decrease in claims to 382,000, down from the prior reading of 411,000.
- • The Conference Board Consumer Confidence Index will be released on Tuesday, with expected reading of 117.
- • The change in Non-farm Payrolls will be released on Friday, with estimates of an increase of 675,000 jobs, up from last month’s reading of 559,000.
- • The unemployment rate will be released on Friday, with median expectations of 5.7%, a decrease from last month’s reading of 5.8%.
INSIGHT: Consumer confidence is expected to increase over last month’s number, signaling the consumer is starting to feel the pressures of the pandemic being lifted and the success of the reopening coming to fruition. Economists are anticipating improvements in the labor market next week in non-farm payrolls, the unemployment rate, and initial jobless claims. The unemployment rate is estimated to come in at 5.7%, which has important implications for monetary policy moving forward. The unemployment rate is one of two factors in the Fed’s dual mandate, which are stable prices and full employment.
MARKET UPDATE(1)
OBSERVATIONS(1)
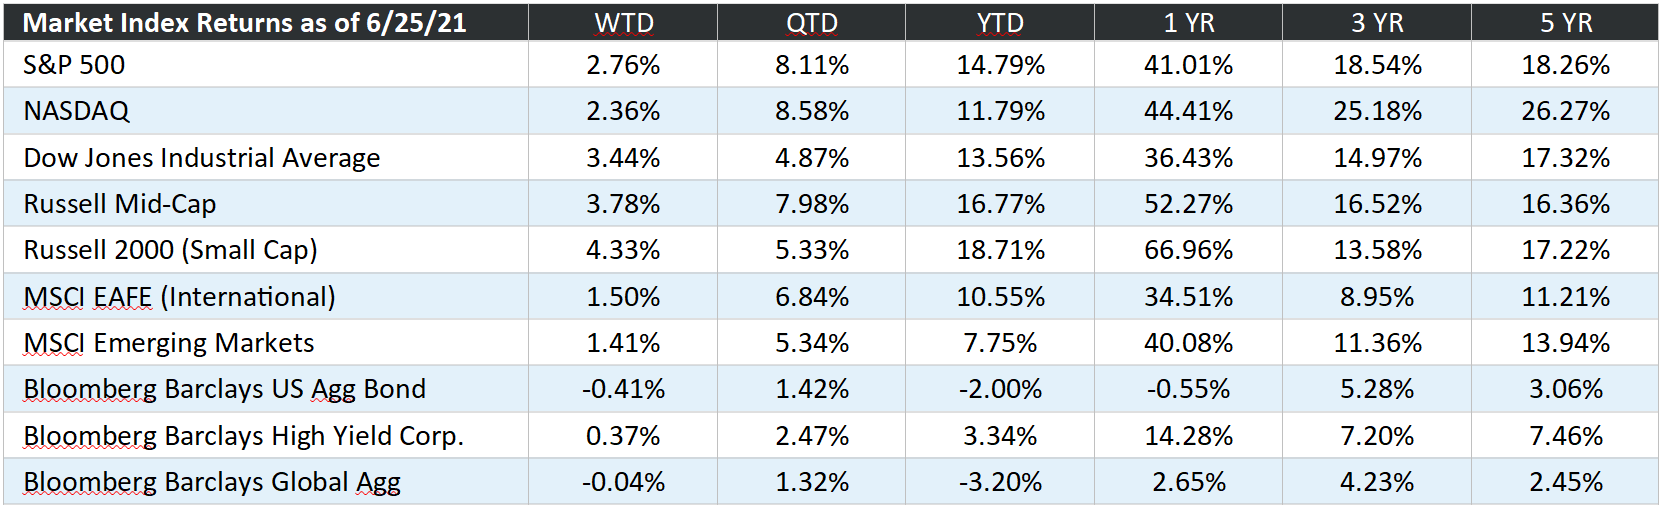
- • U.S. equities moved higher this week as indicated by the S&P 500 which was up +2.76% on the week.
- • In the U.S., smaller sized companies outperformed their larger-sized counterparts, as the Russell 2000 index rose +4.33% on the week.
- • International stocks as measured by the MSCI EAFE were positive on the week, up +1.50%, underperforming domestic stocks.
- • Emerging market stocks were also positive on the week with the MSCI EM index up +1.41%.
- • U.S. investment grade bonds were negative last week with the Bloomberg Barclays U.S. Aggregate Bond index down -0.41%.
FUN FACTS
STOCKS: In the last 30 years, the best 12-month performance for the S&P 500 occurred over the 1-year period that ended 3/31/21. The S&P 500 gained +56.4% (total return) from 3/31/20 to 3/31/21. The S&P 500 consists of 500 stocks chosen for market size, liquidity, and industry group representation. It is a market value weighted index with each stock’s weight in the index proportionate to its market value (source: BTN Research).
NOT IN THE OFFICE: Although only 20% of American employees were “working from home” (WFH) before the pandemic, 71% were WFH by December 2020 and 54% want to continue to WFH after the pandemic is contained. As a result of the change to WFH, the demand for office space is falling, e.g., vacant office space in Manhattan (New York City) is at its highest level in 30 years (source: Pew Research Center).
REAL ESTATE: The 2020 pandemic caused thousands of home sellers to pull their homes off the market, fearful of strangers entering their homes during the crisis. In March 2020 at the start of the pandemic, 1.49 million existing homes were on the market for sale. By March 2021, just 1.05 million homes were on the market. With a smaller supply, home prices soared. The median sales price of existing homes sold rose from $280,700 in March 2020 to $350,300 in May 2021, an increase of +25% in 14 months (source: Nat’l Association of Realtors).
OUT IN THE OPEN: American golfers played 500 million rounds of golf in calendar year 2020, an increase of +13.9% over total rounds played in calendar year 2019. The increase is remarkable given that most golf courses were closed for at least a month in the spring of 2020 (source: National Golf Foundation).
Economic Definitions
Initial Jobless Claims: Initial unemployment claims track the number of people who have filed jobless claims for the first time during the specified period with the appropriate government labor office. This number represents an inflow of people receiving unemployment benefits.
Non-farm Payrolls: This indicator measures the number of employees on business payrolls. It is also sometimes referred to as establishment survey employment to distinguish it from the household survey measure of employment.
Unemployment Rate: The unemployment rate tracks the number of unemployed persons as a percentage of the labor force (the total number of employed plus unemployed). These figures generally come from a household labor force survey.
The Conference Board Consumer Confidence Index: The Consumer Confidence Survey® reflects prevailing business conditions and likely developments for the months ahead. This monthly report details consumer attitude, buying intentions, vacation plans and consumer expectation for inflation, stock prices and interest rates. Data are data available by age, income, region and top 8 states.
Personal Income: Consumer or Household Income (often referred to as personal income) tracks all income received by households including such things as wages and salaries, investment income, rental income, transfer payments, etc. This concept is not adjusted for inflation.
Personal Spending: Consumer or Household Spending (also referred to as consumption) tracks consumer expenditures on goods and services. This concept is not adjusted for inflation.
PCE (headline and core): PCE deflators (or personal consumption expenditure deflators) track overall price changes for goods and services purchased by consumers. Deflators are calculated by dividing the appropriate nominal series by the corresponding real series and multiplying by 100.
New Home Sales: This concept tracks sales of newly constructed homes during the reference period. The Implicit US index is computed by taking the number of house sold in the US and dividing it by the seasonally adjusted number of houses sold in the US.
University of Michigan Consumer Sentiment Index: Consumer confidence tracks sentiment among households or consumers. The results are based on surveys conducted among a random sample of households. Target Audience: representative sample of US households (excluding Alaska and Hawaii). Surveys of Consumers collects data on consumer attitudes and expectations summarized in the Consumer Sentiment, in order to determine the changes in consumers’ willingness to buy and to predict their subsequent discretionary expenditures. This Index is comprised of measures of attitudes toward personal finances, general business conditions, and market conditions or prices. Components of the Index of Consumer Sentiment are included in the Leading Indicator Composite Index. Unit: Index (Q1 1966=100)
The Federal Reserve System: The central bank of the United States. It performs several general functions to promote the effective operation of the U.S. economy and, more generally, the public interest.
Index Definitions
S&P 500: The S&P 500® is widely regarded as the best single gauge of large-cap U.S. equities and serves as the foundation for a wide range of investment products. The index includes 500 leading companies and captures approximately 80% coverage of available market capitalization. NASDAQ: The NASDAQ Composite Index is a broad-based capitalization-weighted index of stocks in all three NASDAQ tiers: Global Select, Global Market and Capital Market. The index was developed with a base level of 100 as of February 5, 1971.
Dow Jones Industrial Average: The Dow Jones Industrial Average is a price-weighted average of 30 blue-chip stocks that are generally the leaders in their industry. It has been a widely followed indicator of the stock market since October 1, 1928.
Russell Mid-Cap: Russell Midcap Index measures the performance of the 800 smallest companies in the Russell 1000 Index, which represent approximately 25% of the total market capitalization of the Russell 1000 Index.
Russell 2000: The Russell 2000 Index is comprised of the smallest 2000 companies in the Russell 3000 Index, representing approximately 8% of the Russell 3000 total market capitalization. The real-time value is calculated with a base value of 135.00 as of December 31, 1986. The end-of-day value is calculated with a base value of 100.00 as of December 29, 1978.
MSCI EAFE: The MSCI EAFE Index is a free-float weighted equity index. The index was developed with a base value of 100 as of December 31, 1969. The MSCI EAFE region covers DM countries in Europe, Australasia, Israel, and the Far East.
MSCI EM: The MSCI EM (Emerging Markets) Index is a free-float weighted equity index that captures large and mid-cap representation across Emerging Markets (EM) countries. The index covers approximately 85% of the free float-adjusted market capitalization in each country.
Bloomberg Barclays US Agg Bond: The Bloomberg Barclays US Aggregate Bond Index is a broad-based flagship benchmark that measures the investment grade, US dollar-denominated, fixed-rate taxable bond market. The index includes Treasuries, government-related and corporate securities, MBS (agency fixed-rate pass-throughs), ABS and CMBS (agency and non-agency).
Bloomberg Barclays High Yield Corp: The Bloomberg Barclays US Corporate High Yield Bond Index measures the USD-denominated, high yield, fixed-rate corporate bond market. Securities are classified as high yield if the middle rating of Moody’s, Fitch and S&P is Ba1/BB+/BB+ or below. Bonds from issuers with an emerging markets country of risk, based on Barclays EM country definition, are excluded.
Bloomberg Barclays Global Agg: The Bloomberg Barclays Global Aggregate Index is a flagship measure of global investment grade debt from twenty-four local currency markets. This multi-currency benchmark includes treasury, government-related, corporate and securitized fixed-rate bonds from both developed and emerging markets issuers.
Disclosures
Index performance does not reflect the deduction of any fees and expenses, and if deducted, performance would be reduced. Indexes are unmanaged and investors are not able to invest directly into any index. Past performance cannot guarantee future results.
Investing involves risk, including the potential loss of principal. No investment strategy can guarantee a profit or protect again loss. In general, the bond market is volatile; bond prices rise when interest rates fall and vice versa. This effect is usually pronounced for longer-term securities. Any fixed-income security sold or redeemed prior to maturity may be subject to a substantial gain or loss. Vehicles that invest in lower-rated debt securities (commonly referred to as junk bonds or high-yield bonds) involve additional risks because of the lower credit quality of the securities in the portfolio. International investing involves special risks not present with U.S. investments due to factors such as increased volatility, currency fluctuation, and differences in auditing and other financial standards. These risks can be accentuated in emerging markets.
The statements provided herein are based solely on the opinions of the Advisor Group Research Team and are being provided for general information purposes only. Neither the information nor any opinion expressed constitutes an offer or a solicitation to buy or sell any securities or other financial instruments. Any opinions provided herein should not be relied upon for investment decisions and may differ from those of other departments or divisions of Advisor Group or its affiliates.
Certain information may be based on information received from sources the Advisor Group Research Team considers reliable; however, the accuracy and completeness of such information cannot be guaranteed. Certain statements contained herein may constitute “projections,” “forecasts” and other “forward-looking statements” which do not reflect actual results and are based primarily upon applying retroactively a hypothetical set of assumptions to certain historical financial information. Any opinions, projections, forecasts and forward-looking statements presented herein reflect the judgment of the Advisor Group Research Team only as of the date of this document and are subject to change without notice. Advisor Group has no obligation to provide updates or changes to these opinions, projections, forecasts and forward-looking statements. Advisor Group is not soliciting or recommending any action based on any information in this document.
